Academia
Empowering research and learning with web-based financial data analytics.
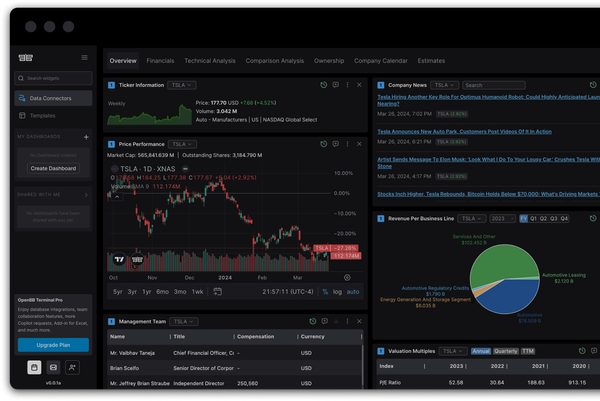
Work from anywhere with the OpenBB Terminal
Our web-based Terminal gives you the flexibility to work from anywhere. Offering advanced AI capabilities and customizable dashboards, it allows you to seamlessly integrate any data and speed up your research.
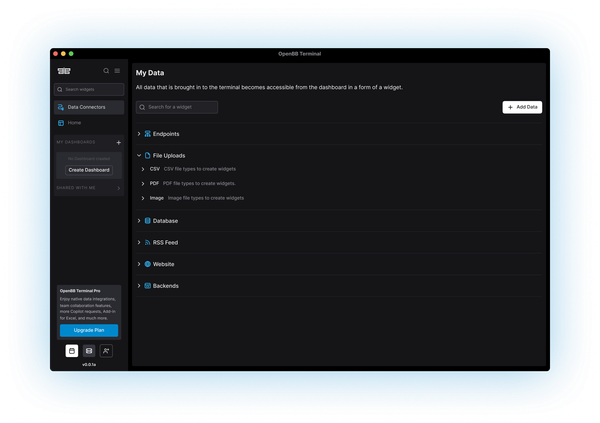
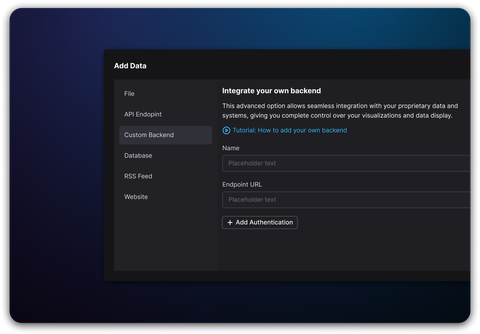
Integrate all the data you need for academic projects
Academia relies on diverse data sources, including financial data, economic indicators, and research reports. Efficiently managing and integrating this data is critical for accurate and comprehensive analysis.One-stop data integration: Access data on various companies, including standardized financial statements, regulatory filings, market reports, and more. Plus, you can integrate data from CSV/Excel files, PDFs, public APIs, databases like Snowflake and SQL, and other sources into one unified platform.
Customizable dashboards: Design dashboards that suit your needs, with widgets displaying key metrics, market trends, and even proprietary data.
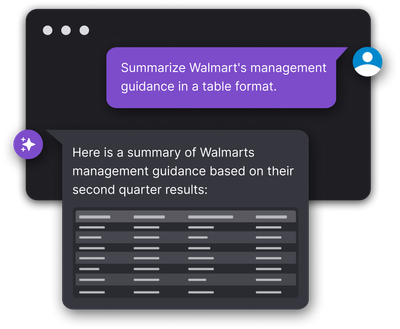
Use AI to speed up your research.
Our Copilot can summarize reports, transcripts or news, do OCR (optical character recognition), perform sentiment analysis, or find trends and patterns in large datasets.Save time: With agentic capabilities, our Copilot is designed to handle complex workflows, helping you build dashboards and get insights in a fraction of the time.
Trust our Copilot: Don't worry about compromising accuracy. Our AI Copilot will help you research faster while also providing reasoning and sources.
Enhancing Academic Research
Imagine you're working on a research project or assignment. With our Terminal, you can:
Aggregate Diverse Data
Retrieve financial data, integrate proprietary research, and upload historical CSV files.
Visualize Trends and Opportunities
Create widgets for market trends, economic indicators, and performance comparisons.
Generate Insights with AI
Use our AI Copilot to identify key patterns and insights relevant to your research.
Next-level Research with our Terminal Pro
If you're looking for extensive packaged data, collaborative features and Add-in for Excel,our Terminal Pro is the solution for you.